
CRM — Sales Dashboard
B2B · analytics
A reporting layer over the CRM: live sales dashboards, forecasting and self-serve charts the team can build without a developer.
-65%
report time

Who are they?
The same sales organisation, now sitting on rich CRM data but unable to turn it into decisions quickly.
- Industry
- B2B services
- Need
- Sales analytics
- Stage
- Scaling ops
What was going wrong?
The data was finally in one place, but answering a simple question still meant a manager exporting a CSV and building a chart by hand — a job that took days and was stale by the time it landed.
Every report was a manual, multi-day export-and-chart exercise
No live view of pipeline health or forecast
Analysts, not the team, held the keys to the numbers
What Nexalinx did about it
We layered a real-time reporting engine on top of the CRM, and put chart-building in the hands of the people who need the answers.
- 01
Live dashboards
Real-time sales and pipeline dashboards on a ClickHouse analytics layer built for fast queries.
- 02
Self-serve charts
Over twenty chart types the team can assemble themselves — no developer, no analyst queue.
- 03
Forecasting
Pipeline forecasting so leadership plans from a live picture instead of last month's spreadsheet.
What the work produced
-65%
time to a report
Real-time
dashboards
20+
self-serve chart types
More success stories
View all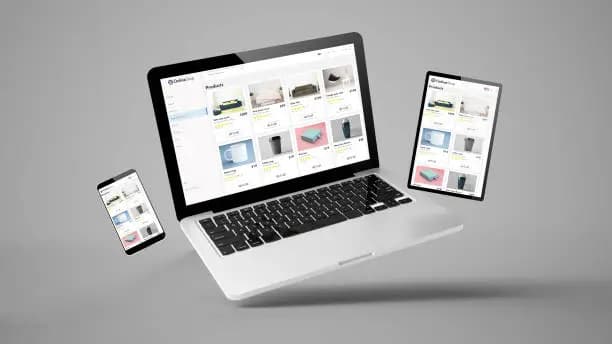 Web
E-commerce Web Platform
A responsive storefront and catalogue that renders fast across every device, with a clean product-management back office.
Read case study Web
Gateoria — Event Planning Platform
An end-to-end event planning web app with scheduling, vendor coordination, ticketing and a real-time attendee dashboard.
Read case study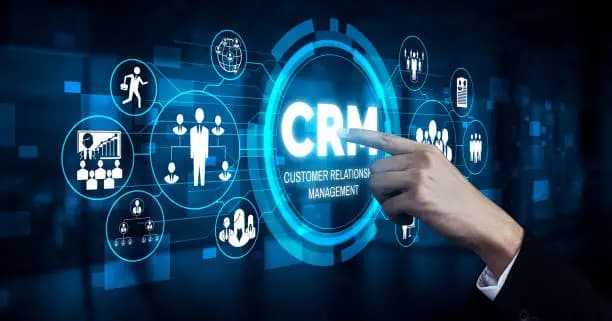 Web
CRM Platform
A pipeline-first CRM with contacts, deals, tasks and permissions — replacing a tangle of spreadsheets for a growing sales team.
Read case studyGet 3 AI & product ideas for your business — free.
Book a discovery call or get an MVP blueprint. No pressure, no jargon — just a clear plan for your idea, workflow or product.
Prefer email? hello@nexalinx.com